Combine the Ideas That Fail Differently
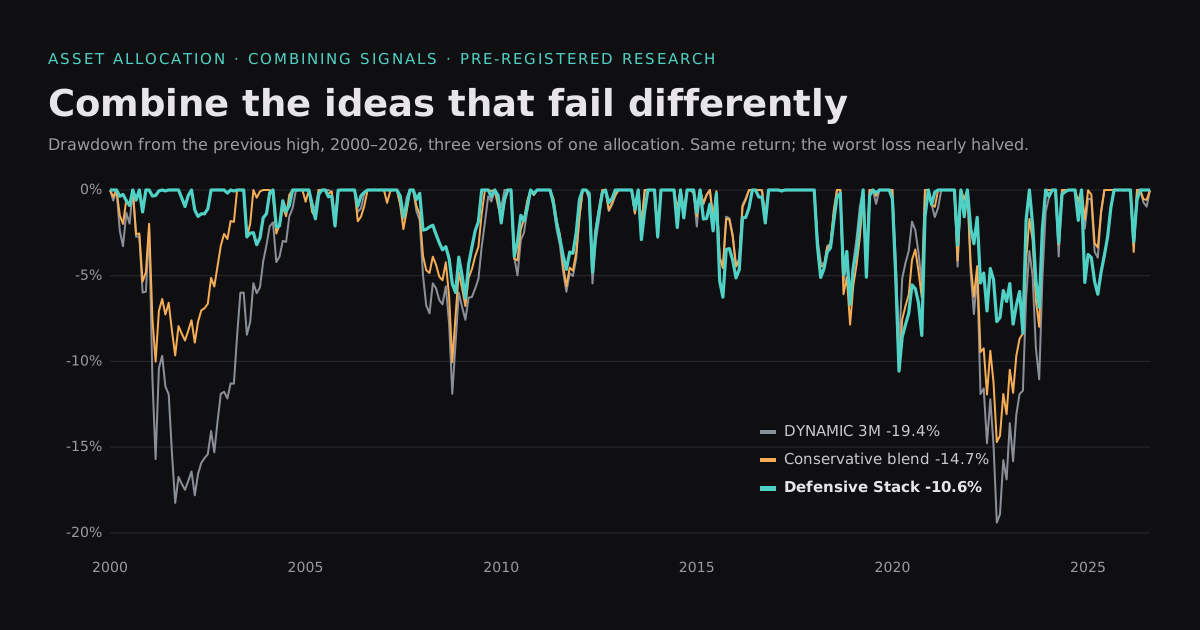
We tested a week's worth of recent arXiv allocation papers against our own published strategy. Almost every headline result failed to replicate. Combining the pieces that failed in the same way did little. Combining the pieces that failed in different ways nearly halved the worst drawdown at the same return.
Our published allocation, DYNAMIC, decides one thing every month: how much of a portfolio to hold in US equities, with investment-grade bonds as the rest. It learns that budget from observable market state: trend, breadth, volatility, the yield curve and unemployment as first published. Over 1998–2026 its three-month version returned 7.36% a year with a worst drawdown of −19.4%.
Nine Experiments, One Result explains why it survived. The Bugs Were Bigger Than the Signal explains why we distrust small improvements to it.
This post is about a different question, asked by our research lead after a run of failures:
Each idea we reject fails on its own. Could the pieces still be useful in combination: better returns, smaller drawdowns, earlier warnings?
The rules we kept
Combining rejected ideas is exactly where research fools itself. Pick the best few out of many, stack them, and the stack looks impressive on pure noise. So every test below followed the same four rules:
- Written down first. Each test's specification, arms and pass criteria were committed to the repository before any return was computed.
- Data the idea had not seen. Where possible, we tested on years outside the paper's sample. For a stock/bond rule that meant rebuilding 1965–1994 from the S&P 500 index, a 10-year Treasury series priced daily from FRED yields, and T-bills.
- Priced selection. When the result was the best of several variants, it had to beat a selection null. That means replaying "pick the best" on the same data with every true effect removed, 2,000 times.
- Sharpe above cash. Several of these ideas hold cash. A Sharpe ratio that ignores the cash rate flatters them.
What the papers claimed, and what we found
| paper | its claim | on our data |
|---|---|---|
| Ceco, Shi & Wong, arXiv:2609.27113: tilt between cap-weight and equal-weight on market diversity | information ratio 0.34, 1995–2024 | 0.02 over 1998–2026; its timing did no better than a shuffled copy of itself |
| Shu, Yu & Mulvey, arXiv:2402.05272: jump-model regime switch | Sharpe 0.68 against buy-and-hold's 0.48, 1990–2023 | 0.39 against 0.53 over the same years; worse than a 200-day moving average in every period |
| Devanathan, Tzikas & Boyd, arXiv:2609.07946: volatility-targeted 60/40 | beats 60/40, 2006–2026 | replicates in their window (0.81 against 0.69); fails in 1995–2005 (0.59 against 0.65), years they did not use |
| the same paper: a two-asset Markowitz rule | higher Sharpe than fixed mixes | on untouched 1965–1994, +0.03, within noise; but its drawdowns were half |
None of this says the authors did anything wrong. Short samples, a window tuned in good faith, and an implementation detail we did not copy exactly can each produce gaps like these. It does say that a published Sharpe ratio is a hypothesis for a component.
The partial results were still interesting. Several ideas did something useful:
- the jump model as an overlay helped DYNAMIC during 2000–2002 and 2008;
- volatility targeting and the Markowitz rule cut drawdowns;
- breadth narrowing really does precede major peaks.
First attempt: stacking things that fail the same way
We combined four bear-market detectors: the jump model, a 10-month moving average, breadth narrowing and a short-term volatility spike. When two agreed, the portfolio switched to the low-volatility Markowitz mix. We also tried feeding the papers' features straight into DYNAMIC's own learning rule.
| result | detail |
|---|---|
| feeding seven new inputs into DYNAMIC's rule | made it worse, −0.47% a year; more inputs diluted the signal |
| "defensive mode" | cut the worst drawdown from −19.4% to −15.6%, in both halves of the sample |
| earlier warning | no combination warned earlier. DYNAMIC already cuts equity within about a month of every major peak since 1998 except one |
The return gain all came from 1998–2010, and every variant gave some of it back after 2011. When we measured why, the answer was plain: the pieces were the same bet. Their monthly contributions were correlated 0.3–0.7, and every one of them helped in slow bear markets (2000–2002, 2008) and hurt in the fast, V-shaped ones that followed (2011, 2018, 2020, 2022, 2025). Stacking them made one bet bigger.
A "fast sell-off detector" added nothing either. It combined credit spreads widening with stocks and bonds falling together. In 46 of the 52 months it fired, another detector was already firing.
The question that worked
So we went back through every paper we had rejected or set aside. This time we asked only one thing:
Does it fail at different times from what we already have?
DYNAMIC has four places where a decision is made:
| decision | what we had done to it |
|---|---|
| how much equity to hold | every detector so far |
| how fast to come back in after a fall | nothing |
| which stocks make up the equity part | always the S&P 500 |
| which bonds make up the rest | always the broad investment-grade index |
Three ideas from the rejected pile worked on the untouched decisions:
- Faster re-entry, from a re-risk rule in Alankar, Maymin & Scholes (arXiv:2603.03213). Once VIX has retraced from its recent high, use DYNAMIC's fast reading instead of its three-month average.
- A sector trend sleeve, from the slow-trend literature (Bouchaud et al.). Hold each of the nine S&P 500 sectors only while it is above its 10-month average, and the index otherwise.
- A bond trend leg. Hold bonds only when they have beaten T-bills over six months, and cash otherwise. This targets 2022, when bonds fell with stocks.
We froze one combination of all of them, "the stack", before any piece was scored.
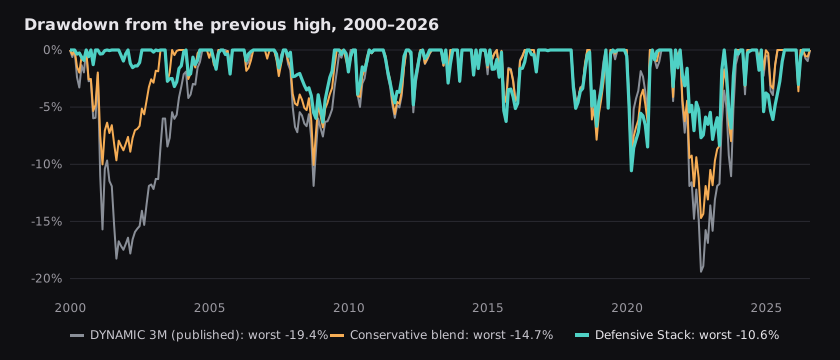
| 2000–2026, same engine and costs | CAGR | Sharpe | worst drawdown | worst 12 months |
|---|---|---|---|---|
| DYNAMIC 3M (published) | 6.68% | 0.85 | −19.4% | −16.9% |
| sector trend sleeve alone | 6.86% | 0.93 | −12.6% | −11.1% |
| Defensive Stack | 6.91% | 1.03 | −10.6% | −6.5% |
What changed this time:
- The sector sleeve cut drawdowns in the fast-crash era too: −12.6% against −19.4% over 2013–2026. It is the first risk-reducing piece we found that did not depend on slow bear markets.
- Faster re-entry worked as intended and failed differently. It brought equity back in a median of 4 months after a trough instead of 6. Its contribution was uncorrelated with the bear-market detectors (−0.03): the first genuinely different piece. On its own it earned almost nothing.
- Together they took the worst drawdown from −19.4% to −10.6%, and the worst 12 months from −16.9% to −6.5%, at a slightly higher return.
What it does not do
We publish the limits with the result.
- It does not beat DYNAMIC's risk-adjusted return since 2013. Measured above cash, the stack's Sharpe since 2013 is 0.78 against DYNAMIC's 0.85. The full-period Sharpe gain comes from the 2000s.
- Its return edge is within selection noise. A third of the selection-null draws do as well as the best of the six combinations we tried.
- It is more complex. Nine sector funds, four detectors and a model refitted every six months. Each moving part is a place for something to break.
So DYNAMIC stays the published allocation. The stack is a better answer to a different question: how much loss can I live with? That makes it a product choice, research claim kept.
What changed on quantify.club
The Agentic page now shows three versions side by side, each with its current target, all recomputed from the same data:
| version | what it is | current target |
|---|---|---|
| DYNAMIC | the published allocation, raw and three-month readings | |
| DYNAMIC Conservative | half DYNAMIC, half the low-volatility Markowitz mix | |
| DYNAMIC Defensive Stack | the frozen stack | 65% equities, no bonds (bond momentum is negative), 35% cash |
A new "Risk improvements since 2000" section shows the drawdown chart above and the table behind it.
The FOMO vs FOBI page gained a watch-only chart of the market-concentration tilt from the Ceco–Shi–Wong paper. Its live bet has been fully equal-weight since 2024, waiting for today's concentration to reverse.
What we take away
- Replicate before you combine. Three of four headline results did not hold on our data or outside the papers' windows. A published Sharpe ratio is where testing starts.
- Combining pieces that fail together amplifies one bet. Measure how the pieces' contributions correlate before you stack them.
- Look for pieces that act on a decision you have not touched. The useful ideas here changed which equities and bonds were held, and how fast the portfolio re-entered, while how much kept its inputs.
- Drawdown and Sharpe are different goals. We roughly halved the worst loss without improving risk-adjusted return since 2013. Both statements are true, and readers deserve both.
- Freeze the combination before you score it, and price the search. Otherwise the best of six looks like a discovery.
Every specification, script and result behind this post is in the Quantify research repository,
under research/combo2, research/combo3 and research/REVISIT-REJECTED.md.
This post describes research on historical data, not a live track record, and it is not investment advice. Past performance does not indicate future results. Market data: Norgate Data (non-commercial research use, no data redistributed), FRED and public ETF prices.